AI Agent Observability with OpenTelemetry: What to Trace and Why
Teams are rapidly deploying AI agents to automate complex workflows, but a critical challenge often emerges post-deployment: what happens when something goes wrong? For VP Engineering, Platform Engineering Leads, and AI Infrastructure Architects in enterprise software, AI platforms, and managed services, the problem is acutely felt. You can pinpoint a model error, but you cannot reconstruct the entire operational path—the session, the specific tool call, the associated cost, the latency, or even the approval flow—that led to an unexpected outcome.
This gap in understanding means that while agent infrastructure is growing, it's often fragmented across teams, making failures incredibly difficult to reconstruct end to end. The promise of autonomous agents clashes with the reality of opaque operations, creating a significant hurdle for reliability and governance. This article outlines a clear, evidence-led approach to achieving comprehensive AI agent observability using OpenTelemetry, moving beyond mere error detection to full operational transparency.
The Observability Gap in AI Agents
Traditional application monitoring, while essential, frequently falls short when applied to sophisticated AI agents. An agent's behavior isn't always linear or predictable. It involves dynamic sequences of model inferences, external tool invocations, human-in-the-loop approvals, and conditional logic. When an agent malfunctions or behaves unexpectedly, the diagnostic process quickly becomes a forensic investigation.
Consider these common pain points:
- Agent infrastructure is fragmented across teams: Different teams might own the base models, the orchestration logic, the tool integrations, and the deployment pipelines. Each component may have its own logging and monitoring, but a unified view of an agent's complete execution path is often missing.
- Failures are difficult to reconstruct end to end: A single error message from a large language model offers little context. Was the prompt malformed? Did a downstream API fail? Was there an issue with the data retrieved by a tool? Without the full context of the session, including every intermediate step, tracing the root cause is a costly and time-consuming endeavor.
- Tenant isolation and capacity controls arrive late: As agents scale, ensuring fair resource allocation and preventing noisy neighbors becomes crucial. Without granular visibility into resource consumption per agent session, implementing effective tenant isolation and capacity management strategies is reactive rather than proactive.
These issues don't just impact debugging; they undermine trust in AI systems, hinder compliance efforts, and directly affect the ability to scale agent deployments reliably and cost-effectively.
OpenTelemetry and AI Agents: A Foundation for Understanding
To bridge this observability gap, a standardized approach is indispensable. OpenTelemetry (OTel) provides a vendor-neutral set of APIs, SDKs, and tools for instrumenting, generating, collecting, and exporting telemetry data (traces, metrics, and logs). Its power lies in establishing common names and attributes, enabling consistent data collection across diverse systems.
For AI agents, OpenTelemetry offers a robust framework for understanding complex interactions. Critically, OpenTelemetry semantic conventions provide common names and attributes for traces, metrics, logs, and events, including generative AI operations. This standardization, detailed in the OpenTelemetry Semantic Conventions specification and the Generative AI attributes registry, means that whether you are observing a prompt, a model inference, or a tool call, the data is structured and interpretable. This shared vocabulary is vital for correlating events across heterogeneous agent architectures and services.
A Telemetry Map for AI Agent Observability
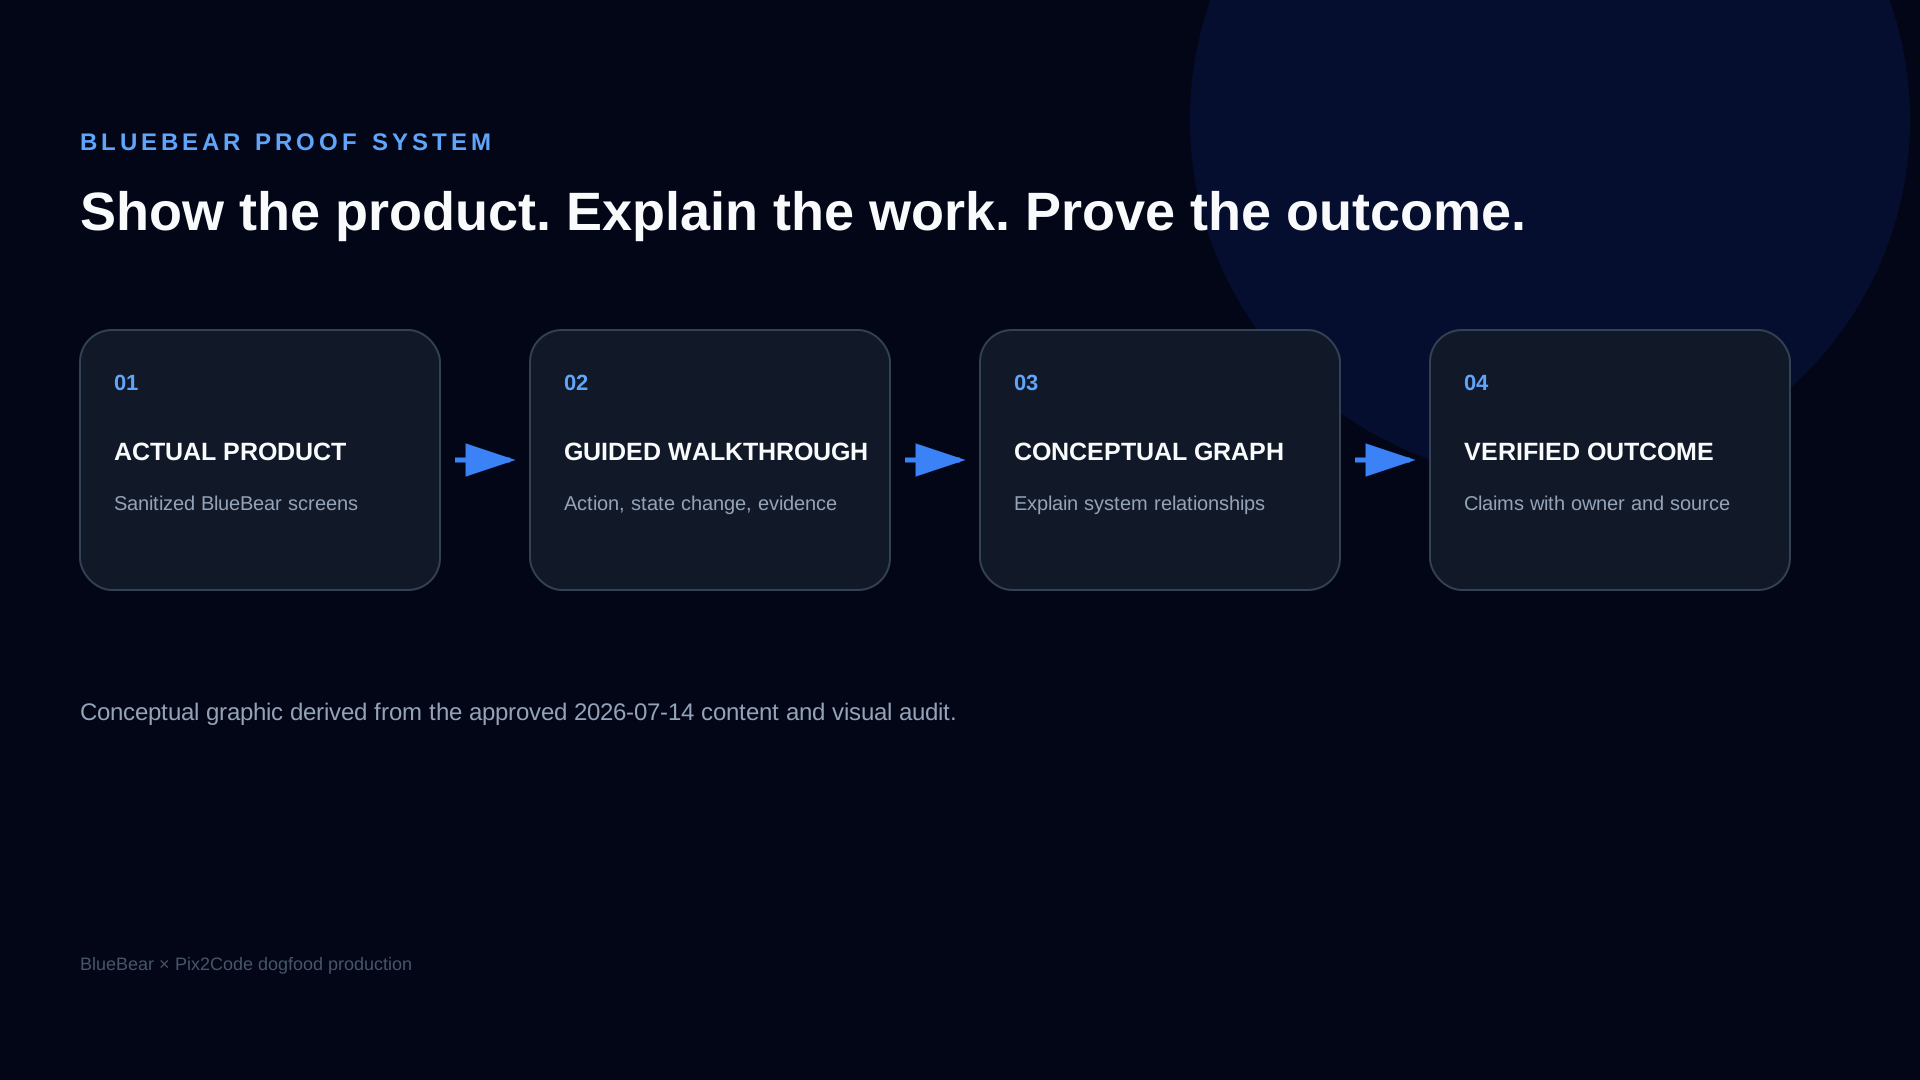
A comprehensive telemetry strategy for AI agents must capture the full lifecycle of an agent's operation. Here's a breakdown of what to trace and why:
- Sessions:
- What to trace: Start and end times, user ID, session ID, initial prompt, and final outcome.
- Why: Provides the overarching context for all agent activity, enabling you to understand user journeys and identify patterns of success or failure.
- Model Calls:
- What to trace: Model ID, input prompt (potentially redacted), output response (potentially redacted), latency, token usage (input/output), and cost.
- Why: Essential for understanding model performance, identifying expensive inferences, and debugging model-specific issues. Given that OpenTelemetry warns that GenAI tool-call arguments and results may contain sensitive information, so content capture needs an explicit policy, careful redaction or exclusion of sensitive content must be a design priority.
- Tools and Functions:
- What to trace: Tool/function name, arguments (redacted if sensitive), results (redacted if sensitive), execution status (success/failure), and latency.
- Why: Crucial for understanding agent decision-making, identifying faulty tool integrations, and verifying the correct execution of external actions.
- Queues and Orchestration:
- What to trace: Queue ingress/egress times, queue length, worker ID, and orchestration step details.
- Why: Reveals bottlenecks, identifies processing delays, and ensures that agent requests are being handled efficiently across the system.
- Costs:
- What to trace: Granular cost metrics associated with model calls, API invocations, and compute resources, linked to session and user IDs.
- Why: Provides financial transparency, enables cost optimization, and supports chargeback models for multi-tenant environments.
- Errors and Exceptions:
- What to trace: Stack traces, error codes, error messages, and contextual metadata.
- Why: Direct insight into failures, allowing for rapid identification and resolution of bugs.
- Correlation Identifiers:
- What to trace: Unique IDs that link all related traces, logs, and metrics across an entire session, even if it spans multiple services or systems.
- Why: Enables end-to-end reconstruction of complex agent workflows, which is fundamental to debugging and understanding agent behavior across distributed architectures.
2026 OpenTelemetry Field Map for Agents and Tools
OpenTelemetry's current GenAI registry includes well-known operations such as invoke_agent, invoke_workflow, and execute_tool. Treat the conventions as a shared vocabulary, then add stable business identifiers for tenant, workspace, workflow version, policy, approval, and accepted outcome.
| Operation | Record | Privacy rule |
|---|---|---|
| Agent/workflow invocation | gen_ai.operation.name, provider, request model, response model, session and workflow. | Do not put personal or secret data in low-cardinality resource attributes. |
| Model call | model, token usage, finish reason, latency, attempt and route. | Prompt and output content are opt-in and separately retained. |
| Tool execution | tool name/type, call ID, status, latency and correlated request receipt. | Tool arguments and results may contain sensitive information; redact or omit by policy. |
| Approval | action fingerprint, requirement, reviewer, decision, expiry and reason. | Store the minimum reviewer identity needed for accountability. |
| Outcome | terminal state, downstream identifier, acceptance, retry and cost. | Link to the system of record instead of duplicating sensitive payloads. |
Test collector loss explicitly. If required evidence cannot be preserved, high-impact execution should fail closed or enter a documented degraded mode.
Practical Diagnostic Checklist for AI Agent Workflows
With a robust telemetry strategy in place, diagnosing AI agent issues becomes a structured process rather than a guessing game. Here's a practical checklist for your team:
- Start with the Session ID: When a user reports an issue, begin by looking up the session ID. This should be your primary correlation identifier.
- Trace the Execution Path: Follow the trace to see the sequence of model calls, tool invocations, and intermediate steps. Identify where the agent deviated from expected behavior.
- Examine Model Inputs and Outputs: Review the (redacted) prompts and responses for each model call. Was the prompt clear? Did the model generate an unexpected output?
- Verify Tool Execution: Check the status and results of all tool calls. Did a tool fail? Did it return unexpected data?
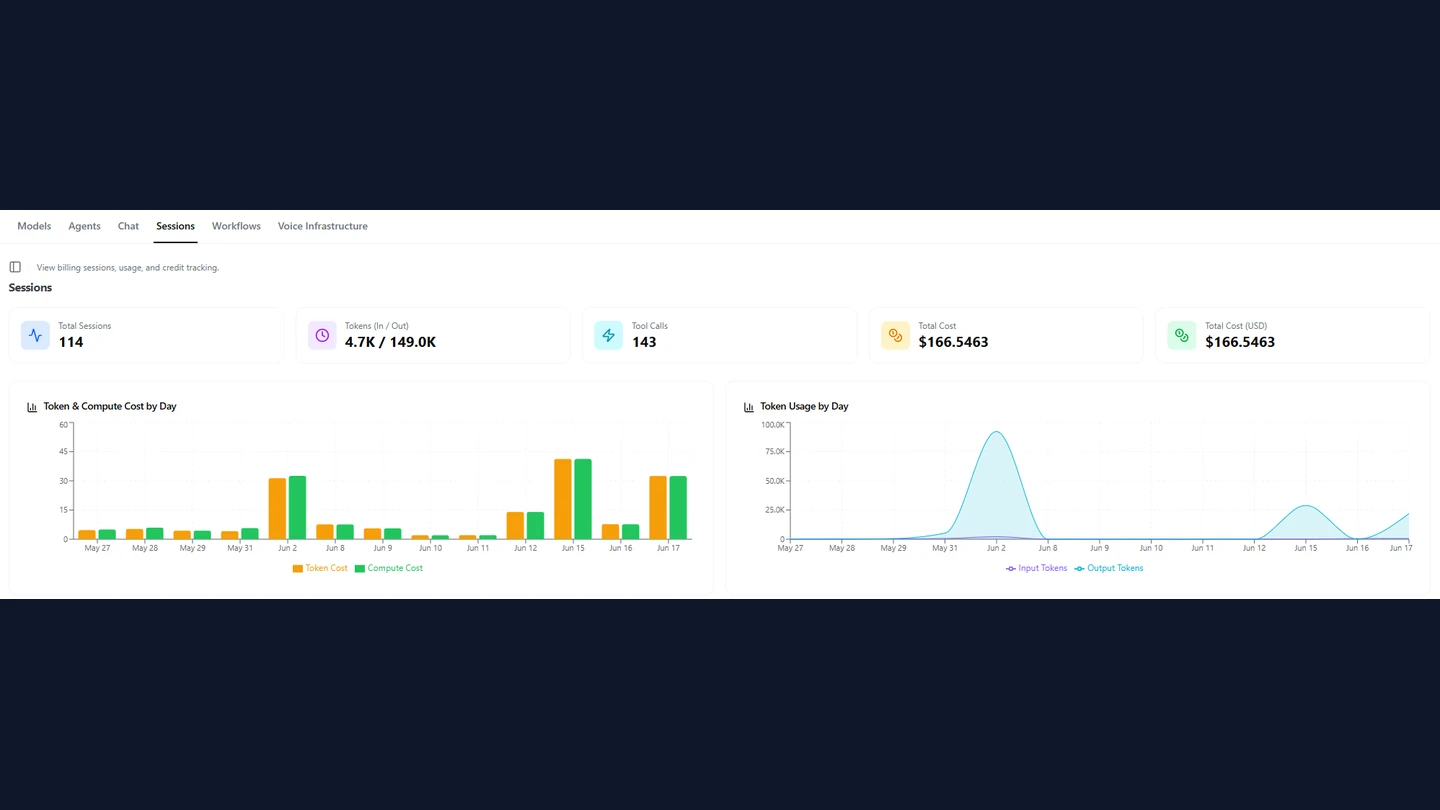
- Monitor Latency and Costs: Identify any unusually high latency points or unexpected cost spikes within a session. This can highlight performance bottlenecks or inefficient resource usage.
- Review Error Logs: Correlate errors with specific steps in the trace. Are there patterns of errors with particular models or tools?
- Assess Queue Backlogs: If an agent response was slow, check the orchestration queues. Was the request delayed due to resource constraints? This speaks directly to mitigating "Tenant isolation and capacity controls arrive late."
- Protect Sensitive Data: Regularly audit your telemetry capture for sensitive information, ensuring redaction policies are enforced, especially for GenAI inputs and outputs.
This systematic approach transforms opaque failures into actionable insights, enabling rapid iteration and improvement of your AI agents.
BlueBear: A Governed Path to Observability
Implementing comprehensive AI agent observability with OpenTelemetry requires not just instrumentation, but also a platform that can manage, process, and present this data effectively, especially in complex enterprise environments. This is where an AI agent platform like BlueBear provides a relevant implementation path.
BlueBear is designed to operate AI agents with governed infrastructure, integrations, evidence, and cost controls. Its MCP gateway and governed agent runtime offer a centralized point for managing agent deployments, ensuring that observability is built-in from the ground up rather than bolted on later. By standardizing the collection and correlation of OpenTelemetry data, BlueBear enables organizations to gain end-to-end visibility into agent performance, cost, and behavior. This directly addresses the pain point of fragmented agent infrastructure and difficult failure reconstruction by providing a unified operational view.
Next Steps: Evaluating Your Observability Workflow
Before rushing to implement another new tool, the most valuable next step for any VP Engineering, Platform Engineering Lead, or AI Infrastructure Architect is to evaluate the current workflow before adding another tool. Understand your existing gaps in AI agent observability. Map out the information your teams lack when diagnosing agent failures. Consider how a standardized approach like OpenTelemetry, coupled with a platform that supports its full lifecycle, can transform your operational capabilities.
For a deeper dive into practical implementation strategies and to see how unified cost and performance visibility can be achieved, you might find a supporting asset like the "BlueBear session cost overview" valuable. This resource provides further context on managing the operational economics of AI agents within a governed framework.
Questions people actually search for
- what should you trace for ai agent observability
Trace runs and steps, model calls, tool operations, policy decisions, approvals, retries, failures, latency, token usage, cost, artifacts, and terminal outcomes with stable correlation identifiers.
- can opentelemetry trace ai agents
Yes. OpenTelemetry can carry correlated spans, metrics, logs, and GenAI attributes across model, tool, and workflow boundaries. You still need an application-level evidence model for authority, approvals, and accepted outcomes.
- should prompts be stored in opentelemetry traces
Not by default. Prefer structural metadata and references; capture prompt or tool content only for a documented purpose with redaction, restricted access, encryption, short retention, and secret-detection tests.
- is ai observability the same as an audit trail
No. Observability explains system behavior and health, while an audit trail proves identity, authority, decisions, execution, and outcomes. They can share correlation IDs and storage components without becoming the same record.