Disclosure: BlueBear builds an AI agent platform and an MCP gateway, so we have a commercial interest in this topic. The method below works with any provider or framework; where we reference our own implementation we say so.
The short answer: rank by step, not by model
The most common cost analysis is a pie chart of spend by model. It is nearly useless. It tells you which model you use most, which you already knew, and it suggests exactly one intervention: use a cheaper model. That intervention is a quality gamble taken without evidence.
The useful cut is by step — a named position in your agent. "Tool selection." "Final response." "Verification." "Retrieval query rewriting." Steps are the unit you can actually change, and they have different quality requirements, so a step-level ranking converts one risky global decision into several bounded local ones.
Getting there needs one field: a step name on every call. If you have that, everything below is a query. If you do not, adding it is the highest-value hour of work available to you, and it does not require changing a single model.
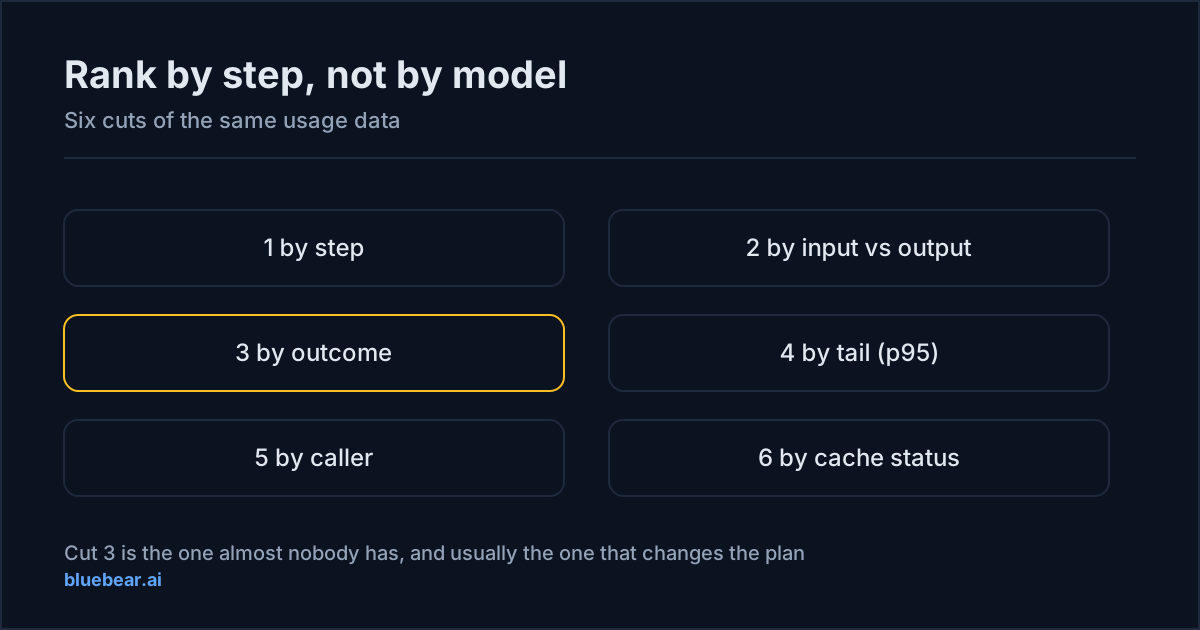
Six cuts of the same data
Cut 1 — by step
Total spend grouped by step name, sorted descending. The first read is usually surprising: in agents with retrieval, "tool selection" is often first, not "final response", because tool-selection calls are the iterations and iterations are where accumulated context lives.
What to do with it: take the top step and ask what quality bar it actually needs. If the top step is classification, you have found a large, low-risk saving. If it is the final customer-facing response, you have found something you should be careful with.
Cut 2 — by input versus output tokens
For each step, the split. Output tokens are priced above input tokens by every major provider, so a step that is output-heavy has a different fix (shorter generation, tighter schemas, explicit length limits) from one that is input-heavy (smaller tool results, trimmed history, caching).
Applying an input-side fix to an output-heavy step is how teams spend a week and move nothing.
Cut 3 — by outcome
Spend on runs that succeeded, versus runs that were retried, failed, or abandoned. This is the cut almost nobody has, and it is usually the one that changes the conversation.
Work that produced nothing cost full price. If it is 15% of spend, then every efficiency number you report is 15% optimistic, and — more importantly — a reliability fix is now competing directly with a routing project for the same budget, and may well win. Establishing a cost baseline covers the measurement-window and rate-source discipline that keeps the comparison defensible.
Cut 4 — by tail
Median cost per run against p95. Agent cost distributions are long-tailed, which makes the mean actively misleading: it lands between a large population of cheap runs and a small population of expensive ones and describes neither.
If p95 is many multiples of the median, look at what the expensive runs have in common. It is usually one input class — a document type, a customer whose data is shaped differently, a query that sends the agent exploring. Fixing one input class can move total spend more than a model change, and it carries no quality risk at all.
Cut 5 — by caller
Spend grouped by the customer, tenant, or internal system that caused it. This is where you find the test suite pointed at production keys, the cron job nobody remembers, and the one customer whose usage pattern is nothing like the others.
This cut is impossible without attribution captured at call time. In our gateway the tenant is resolved from the authenticated credential rather than supplied by the application, which is the property that matters: it means a background job written by someone who never read the convention still produces attributed usage.
Cut 6 — by cache status
If your provider reports cached token counts, the ratio of cached to fresh input tokens per step. A step with a large stable prefix and a near-zero cache ratio is a bug, not a cost profile, and it is usually a volatile value at the front of the prompt.
What to instrument, minimally
| Field | Level | Which cut it enables | Recoverable later? |
|---|---|---|---|
| Step name | Call | 1, 2, 6 | No |
| Input / output tokens | Call | 1, 2, 4 | Sometimes, from provider logs |
| Cached tokens | Call | 6 | No |
| Model | Call | All | Usually |
| Run ID | Call | 4 | No |
| Caller / tenant ID | Call | 5 | No — never |
| Outcome | Run | 3 | No |
| Human correction | Run | 3 | No |
Read the right-hand column before deciding what to defer. Almost none of this is recoverable, which means every day without it is a day of permanently un-analysable spend. The caller identifier in particular is gone forever — no provider invoice can tell you which of your customers caused a charge.
Two implementation notes worth stealing
Record the unit with the price. Per-1K and per-1M pricing conventions coexist across providers and a factor-of-1000 error is easy and embarrassing. Our token-pricing projection makes the unit an explicit field rather than a convention — unitTokens: 1_000_000 alongside inputCostPer1m, outputCostPer1m, and a currency — so nothing downstream has to infer it.
Record how an estimate was derived, not just its value. A cost number without provenance cannot be defended in a review. Our candidate scores carry an estimateSource of "default" | "request" | "observed", and any projection records whether it came from an explicit token demand or a message heuristic. When you present a saving, being able to say which portion rests on observed data and which on heuristics is the difference between a finding and an assertion.
Turning the ranking into a plan
Once the ranking exists, sort candidate changes by risk rather than by size:
- No quality risk. Shrinking tool results, fixing a broken cache prefix, removing a duplicate call, deleting a step that never changes the answer. Do all of these first. They need no evaluation because there is nothing to trade off.
- Bounded quality risk. Moving a classification step to a cheaper model. Needs an acceptance test, but the test is cheap and the step is isolated — see is a cheaper model good enough?
- Real quality risk. Changing the model on the final customer-facing response. Needs a held-out evaluation and a staged rollout: canary rollout for routing.
- Structural. Redesigning the agent to take fewer steps. Highest ceiling, longest lead time, and worth planning against the numbers rather than the intuition.
Most teams start at 3 because it is the most discussed. Categories 1 and 2 usually contain more money and none of the argument.
Do this next
Add a step name to every model call in your highest-volume agent. One field, one afternoon. Then run cut 1 and cut 3 — spend by step, and spend by outcome. Those two tables are the whole diagnosis, and everything in why AI agent costs spike becomes answerable in minutes instead of days.
Questions people actually search for
- how do I find which llm calls cost the most
Rank spend by step rather than by model or by endpoint. A step is a named position in your agent — "tool-selection", "final-response", "verification" — and it is the unit you can actually change. Ranking by model tells you which model you use most, which you already knew. Ranking by step tells you where to spend an afternoon.
- what should I log for llm cost tracking
Per call: a step name, input and output token counts, the model, a caller or tenant identifier, cached-token counts if your provider reports them, and a run identifier so calls can be grouped. Per run: the outcome — succeeded, retried, failed, abandoned — and whether a human corrected the result. The run-level outcome is the field that turns a spend report into a unit-economics report, and it is the one most commonly missing.
- how do I attribute llm cost to a customer
Attach the customer identifier at the moment of the call and store it with the token counts. It cannot be reconstructed afterwards — a provider invoice knows an API key, not a customer. The most robust implementation derives the identifier from the authenticated caller rather than trusting the application to supply it, because a convention that must be remembered will eventually be forgotten by a background job.
- is average cost per request a useful metric
On its own, no — agent cost distributions have long tails and the mean sits in an empty region between a large cheap population and a small expensive one. Report the median and the p95 together. If p95 is many times the median, your cost is concentrated in a minority of hard requests, and that is a targeting problem with a completely different fix from a pricing problem.