Disclosure: BlueBear builds an AI agent platform and an MCP gateway, so we have a commercial interest in this topic. Nothing below is a customer measurement; the worked numbers are illustrative and labelled as such, and the implementation details are quoted from our own source.
The short answer: check retries and step count before you check the model
When an agent bill jumps without a deploy, the instinct is to look at model pricing. That is almost never it. In a multi-step agent, the price per token is the least volatile input in the whole system — everything else about the workload can double while the price sheet stays put.
The productive first move is one comparison, and it takes minutes: tokens per request, split into input and output, for last month against this month. The shape of the change tells you where to look.
| What changed | Most likely cause | Where to look next |
|---|---|---|
| Request count up, tokens per request flat | Genuine demand, or a new caller you have not attributed | Split traffic by caller. A background job or a test suite is a common surprise. |
| Input tokens per request up, output flat | Context accumulation, or a cache that stopped hitting | Causes 3 and 4 below. |
| Both up, roughly proportionally | More steps per request | Cause 2. |
| Output tokens up sharply | Generation length — a prompt change, or reasoning-style output | Cause 6. |
| Nothing per-request changed, spend still up | Failed and retried work | Cause 1. This is the most common answer and the hardest to see. |
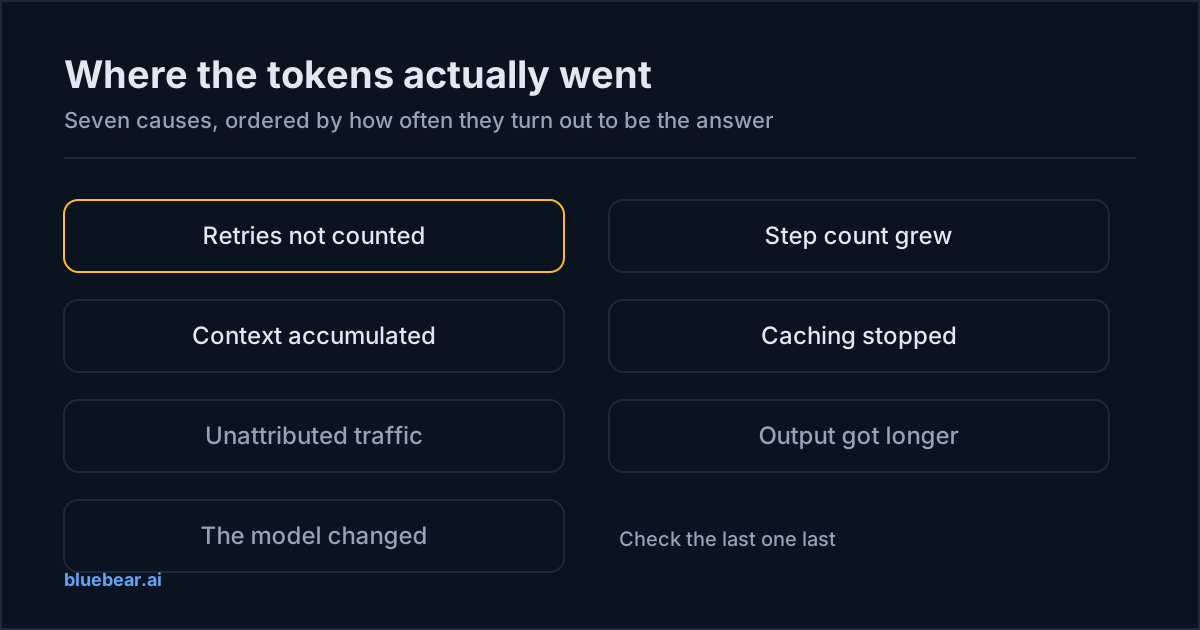
Now the seven causes, ordered by how often they turn out to be the answer rather than by how interesting they are.
1. Retries and failures you are not counting
Every attempt bills. A call that timed out bills. A call that returned malformed JSON and was retried bills twice. An agent that hit its iteration cap and returned nothing bills for every iteration it took getting there. A guardrail that rejected an output bills for producing the output and for the check.
This is the single largest gap between what teams think they spend and what they spend, because almost every cost dashboard counts calls and almost none tag them with an outcome. If a fifth of your work fails and is retried, your cost per delivered result is roughly 25% above your cost per attempt, before any human time.
The fix is not to eliminate retries — retries are load-bearing. The fix is to record the outcome on the usage row so the denominator is honest. The cost-per-outcome calculator is the arithmetic; cost per completed workflow is the framing.
2. Step count grew, and step growth is superlinear
An agent request is not one model call — planning, tool selection, retrieval, summarisation, retry, verification and final response are each separate calls, and a tool-calling agent re-sends the accumulated conversation on each iteration. So the cost of a run does not grow linearly with steps; input tokens grow roughly with the square of the step count.
The practical consequence is that a change which raises median steps from four to six can raise cost by far more than 50%, and nothing about the change looks expensive in review. Adding one tool. Loosening a prompt so the model explores. Making retrieval optional so the agent decides. All of these move step count.
Measure median and p95 steps per run. If p95 is much higher than median, a minority of hard inputs is carrying most of the cost, which is a targeting problem rather than a pricing one. One request, many model calls pulls this apart properly.
3. Context accumulated
Conversation history grows. Retrieved chunks got bigger because someone raised k. A tool started returning a richer response after an upstream API version bump. A system prompt acquired three more examples.
All of these raise input tokens per call, and in an agent they raise it on every iteration of every run. A tool whose response grew by 4 KB does not cost 4 KB more — it costs 4 KB more per remaining iteration of the agent that called it.
This one is worth checking against upstream changes you did not make. An API you call adding fields to its response is a cost change in your system that appears in nobody's changelog.
4. Prompt caching stopped working
Caching is priced well below fresh input tokens by the major providers, and an agent re-sending a near-identical prefix on every iteration is close to the ideal workload for it. Which means losing it is a large, invisible regression.
The classic cause is something volatile at the front of the prompt: a current timestamp, a request ID, a per-user greeting, a randomly ordered tool list. Any of these invalidates the prefix on every call. Diff the rendered prompt for two consecutive requests — not the template, the rendered string. Provider cache lifetimes and minimum prefix lengths differ and change; check the current documentation rather than assuming what you learned last year still holds.
5. Traffic you have not attributed
An integration test suite pointed at production keys. A cron job someone added. An internal tool nobody counts as a customer. A retry loop in a client that fires on a 429 you started returning.
You cannot find this without per-caller attribution, and attribution cannot be reconstructed after the fact — a provider invoice knows an API key, not a caller. If every call from your system is indistinguishable in your own records, this cause is permanently invisible to you, and that is worth fixing on its own merits.
6. Output got longer
Less common, but sharp when it happens, and output tokens are priced above input tokens by every major provider. Causes: a prompt change that removed a length constraint, a switch to a model that reasons at length by default, or structured output where the schema grew.
Easy to confirm and easy to fix — the check is output tokens per call across the two periods, and the fix is usually an explicit length instruction plus a maximum token cap. Worth doing early precisely because it is cheap to rule out.
7. The model actually did change
Last, because it is last. A default that moved on a library upgrade. A fallback that fires more often than it used to and lands on a more expensive model. An alias that now points somewhere else.
Fallback drift is the interesting version of this. A fallback path is by definition the path you are not watching, and a rising fallback rate is both a cost event and a reliability signal. Our gateway attaches a distinct reason string to every fallback — a planner timeout produces route_plan_timeout, a non-2xx produces route_plan_http_<status>, a missing planner URL produces inference_os_base_url_missing — for exactly this reason. "We fell back a lot" and "we fell back a lot because the planner was unreachable" are different incidents.
An illustrative worked example
The following figures are constructed to show the arithmetic. They are not measurements of any customer or of our own platform.
Suppose a support-triage agent handles 10,000 requests a month. In June it averaged 4 model calls per request. In July, after a tool was added, it averaged 6. Nothing else changed and the tokens per call stayed roughly flat at an assumed 3,000 input and 400 output.
- June: 10,000 × 4 = 40,000 calls
- July: 10,000 × 6 = 60,000 calls — a 50% rise from adding one tool
Except calls are not the right unit, because each additional step also carries the prior steps. If the accumulated input at step n grows with n, total input tokens scale with roughly n(n+1)/2 rather than n: from 10 units to 21 per request, a 110% rise in input tokens for a 50% rise in calls. Now add a 15% retry rate on the harder cases and the gap widens again.
The point of the example is not the numbers, which are invented. It is that "we added a tool" and "our bill doubled" are the same event, and no dashboard that reports spend per month will connect them.
What to put in place so the next spike takes an hour
- Tokens split by input and output, per request. The single most diagnostic pair of numbers.
- Steps per run, median and p95. Cause 2 is invisible without it.
- An outcome on every usage row. Succeeded, retried, failed, abandoned. This is what makes cause 1 visible.
- A caller identifier on every call. Attach it at call time; it cannot be recovered later.
- A ceiling that stops rather than warns. Alert thresholds tell you afterwards. In our billing services, budget alerts are typed — remaining-percent, remaining-credits, expiring-soon, and exhausted — and exhaustion short-circuits the others and becomes a hard block rather than another warning. Whatever you build, decide which of your controls actually stops work.
The first four are recording decisions, not infrastructure. They cost an afternoon and they are the difference between a spike being a half-day investigation and a fortnight of argument.
Do this next
Pull tokens per request, split input and output, for the last two full months. That one table eliminates most of these seven causes immediately. Then work through finding your most expensive LLM calls to turn the surviving suspects into a ranked list.
Questions people actually search for
- why is my openai api bill so high
In an agent workload, almost never because the price per token changed. The usual causes, in rough order of frequency: retries you are not counting, a rise in the number of steps per request, conversation or tool context accumulating so each call carries more input, prompt caching silently missing, and traffic from a background job or a test suite that nobody attributed. Get token counts split by input and output before you look at model choice — the shape of that split narrows the cause immediately.
- my ai costs went up but usage did not change
Then the cost per request went up, and there are only a few ways that happens without a price change. Either each request is now making more model calls (more agent steps, a new tool, an added verification pass), or each call is carrying more tokens (accumulated history, a larger retrieved context, a bigger tool result), or a cache that was working has stopped. Compare tokens per request between the two periods, not spend per period — that single comparison eliminates most of the possibilities.
- how do I find what is driving my llm costs
Split spend three ways before doing anything else: by model, by input-versus-output tokens, and by whether the request succeeded. Most teams have the first, few have the second, almost nobody has the third. The third is usually where the surprise is — failed and retried work costs full price and produces nothing, and it is invisible in any dashboard that only counts calls.
- do retries count towards my llm bill
Yes, in full. Every attempt is billed whether or not it produced a usable result — including attempts that timed out, hit a guardrail, returned malformed JSON and were retried, or were abandoned when an agent hit its iteration cap. This is why cost per successful outcome and cost per call diverge, and the gap between them is a number worth knowing.